plotSbm method for SimpleSBM_fit object
Arguments
- x
Sbm model of class `"SimpleSBM_fit"`
- ordered
Boolean. Set
TRUEif the matrix should be reordered (Default isFALSE)- transpose
isn't used in this method
- labels
named list (names should be: `"col"` and `"row"`) of characters describing columns and rows component (Default is
NULL)- plotOptions
list providing options. See details below.
Value
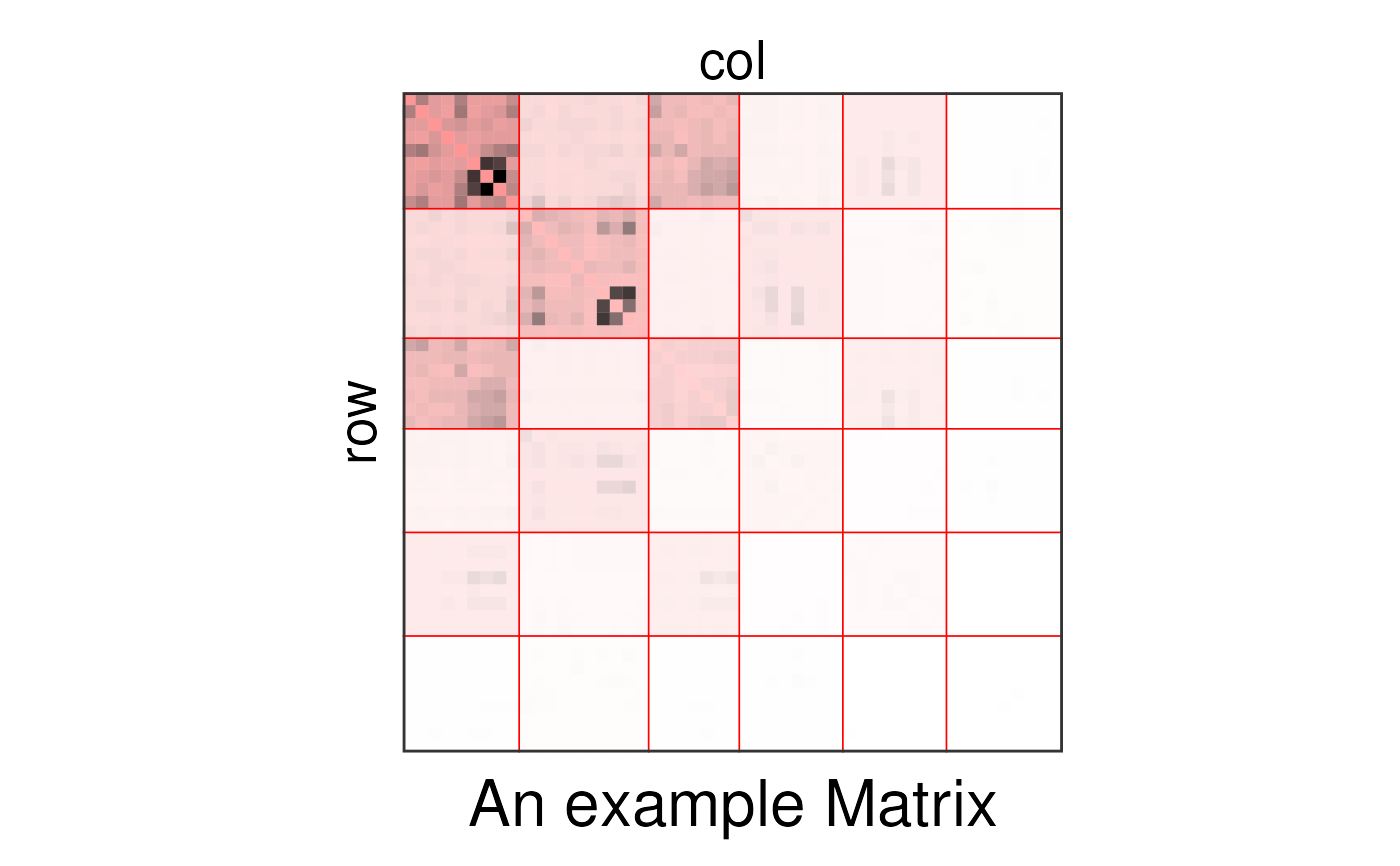
a ggplot object corresponding to the matrix plot inside the app. Groups the network matrix is organized by blocks, the small tiles are for individuals connections. The big tiles between red lines are for block connectivity
Details
The list of parameters plotOptions for the matrix plot is
"showValues": Boolean. Set TRUE to see the real values. Default value is TRUE
"showPredictions": Boolean. Set TRUE to see the predicted values. Default value is TRUE
"title": Title in characters. Will be printed at the bottom of the matrix. Default value is NULL
"colPred": Color of the predicted values, the small values will be more transparent. Default value is "red"
"colValue": Color of the real values, the small values will close to white. Default value is "black"
"showLegend": Should a legend be printed ? TRUE or FALSE, default: FALSE
"interactionName": Name of connection in legend default: "Connection"