plotSbm method for matrix object
Arguments
- x
numeric matrix
- ordered
Boolean. Set
TRUEif the matrix should be reordered (Default isFALSE)- transpose
Boolean. Set
TRUEto invert columns and rows to flatten a long matrix (Default isFALSE)- labels
named list (names should be: `"col"` and `"row"`) of characters describing columns and rows component (Default is
NULL)- plotOptions
list providing options. See details below.
Value
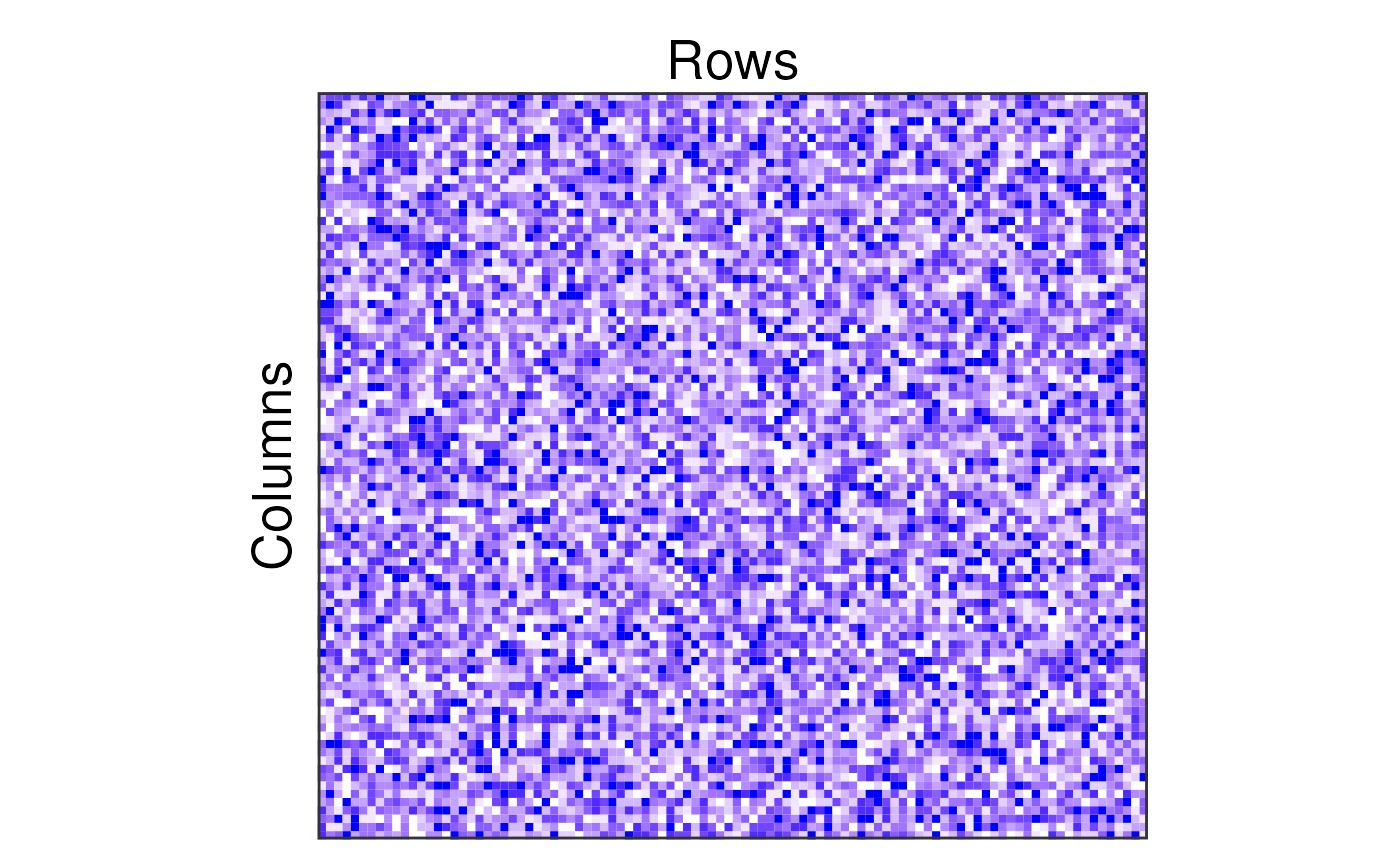
a ggplot object corresponding to the matrix plot inside the app. Here because there no 'sbm' information and only a matrix describing a network, The matrix isn't organized and the tiles are only showing individuals connections.
Details
The list of parameters plotOptions for the matrix plot is
"showValues": Boolean. Set TRUE to see the real values. Default value is TRUE
"showPredictions": Boolean. Set TRUE to see the predicted values. Default value is TRUE
"title": Title in characters. Will be printed at the bottom of the matrix. Default value is NULL
"colPred": Color of the predicted values, the small values will be more transparent. Default value is "red"
"colValue": Color of the real values, the small values will close to white. Default value is "black"
"showLegend": Should a legend be printed ? TRUE or FALSE, default: FALSE
"interactionName": Name of connection in legend default: "Connection"